Introduction
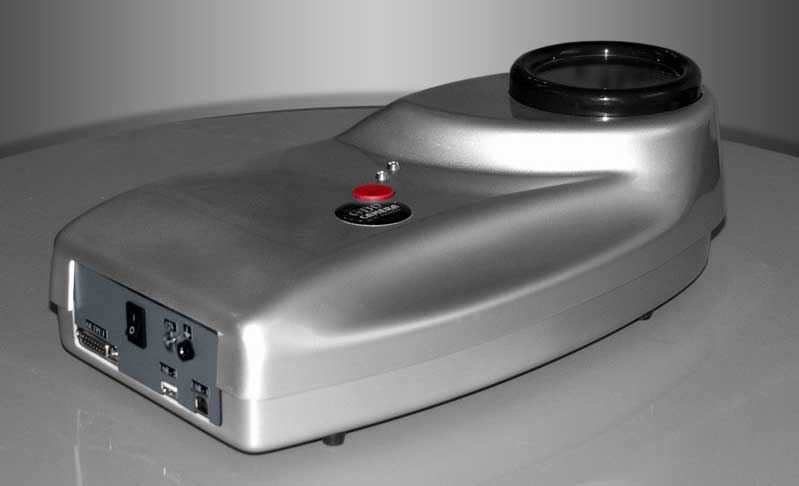
In the history of Science, developing of a new instrument has always resulted in new understanding of Reality. Microscope, telescope, X-rays, camera, laser, computer - without these instruments the modern science is powerless. Recently a new instrument came to being - a solid state computerized Gas Discharge Visualisation (GDV) electro-photonic camera for bio-electrography.
The GDV technique is based on so-called Kirlian effect, named after Semion Kirlian and his wife, who photographed and studied stimulated electro-photonic images around various objects and first noticed that parameters of these images strongly depend on psychological and physiological state of a person
Internationally distinguished physicist, Prof Konstantin Korotkov from St. Petersburg in Russia studied the information aspect of stimulated electro-photonic emissions around the human body and other objects for several decades, following his personal contacts with Semion Kirlian.
He found, that in order to be able to extract reliable and repeatable information from the recorded electro-photonic glow it was necessary to optimize the apparatus. In particular it was necessary to minimize the influence of the ambient temperature and humidity, use a digital camera rather than a photographic process for recording images and optimize parameters of the process of stimulation of electro-photonic emissions.
In 1996 Prof Korotkov developed a range of instruments for stimulation, recording and processing of electro-photonic images and called his technique Gas Discharge Visualization (GDV).
Gas Discharge Visualization technique, as any other perturbation method used in science, can be used to extract information about objects being studied.
One of the most significant applications of the GDV technique today is assisting health professionals in quick and accurate assessment of human state and in comparing effectiveness of various therapies.